‘Flatten the curve’ has become a catchphrase of the coronavirus pandemic.
It’s what the epidemiologists (people who study the spread of infectious diseases) and policymakers both want to achieve. But you might be asking: “what is the curve?”, “How do we model the spread of diseases in the first place?” and “What’s the point of it all, with math?”
Exponential Growth vs. Linear Growth
Now, if you’re anything like me, you probably find yourself looking back on the past weeks and thinking: “how has a virus gotten so big so fast?”
The South China Morning Post reported the first case of coronavirus on November 17th 2019. So why has it all just blown up now, in the space of a few weeks, 3 months after the first case?
The answer has to do with how epidemics spread.
One of the main tools in the statistician’s toolbox is the mathematical model.
Simply put, this is just an equation telling us how one piece of information changes relative to another.
For example, how the heights of trees vary according to weight, or how grape harvest varies according to rainfall, or even how the currency exchange rate changes over time. Each one of these scenarios will have its own equation predicting how the numbers behave.
The simplest type of mathematical model is the linear model.
On a graph a linear model looks like a straight line. Going back to the tree example, we might have a model like this:
Weight of Tree (kg) = 7 * Height of Tree (m) + 15
This model then predicts that a tree 5m tall weighs 50kg. Ok, this might be a simplified example, but lots of data in the real world follows these linear patterns too.
Another common type of model is the exponential model.
To understand this, think of bacteria replicating in a petri dish. Suppose you start at hour 0 with 1 bacterium in a dish and say that every hour the bacteria in the dish each replicate themselves. So, after 1 hour we have 2 bacteria, after 3 hours we have 4 bacteria, 4hrs = 8 bacterium and so on. A mathematical model for this might look like:
Number of Bacteria = 2 (hours elapsed)
You can see that under an exponential model, one un-threatening bacteria becomes an army of over 16 million bacteria in just over one single day.
Now let’s get back to the coronavirus.
How do we model the number of cases of Covid-19 against time?
Given the simplicity of a linear model, you might be tempted to suggest that the number of cases increases linearly. That is, there are the same number of new cases each day.
But looking at WHO figures, we see that on February 12th there were 2068 new cases recorded from the previous day, and 2 months later this increased over 42-fold to a whopping 85,679 new cases from the previous day!
Whilst we might wish this was a linear model, unfortunately it isn’t.
And when you think about it, this sort of makes sense, doesn’t it? Like a bacterium doubling, if every infected person meets a healthy person and infects them, the number of cases has doubled?
Generally speaking then, an epidemic is initially modelled using an exponential model.
How Do We Model the Spread of Infectious Diseases?
A key to how epidemiologists model outbreaks is summed up in the ‘R0 value’ of a disease.
This is the average number of people every infected person will also infect.
A simple exponential model of this looks like:
No. of Cases = Number of cases(Day 0) * R0(days since first infection)
This might look simple, and that’s because it is a simplified model.
How, for example, does the disease spread among communities, how does spread vary according to the weather – and how do we find R0 in the first place? These are all question that researchers are working to find.
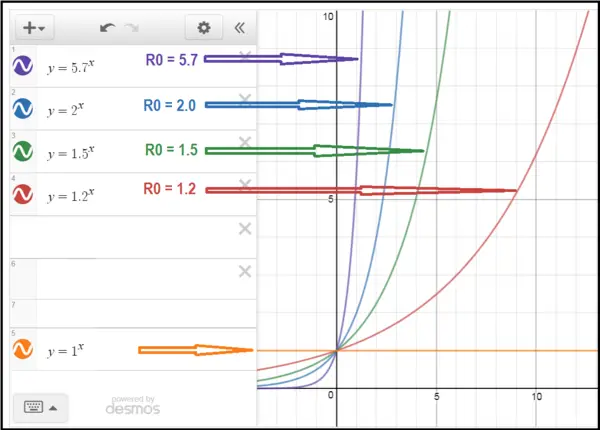
But by plugging in different values for R0 we can see that if R0 > 1 it’s bad news and the disease will grow – this is an epidemic.
If R0 = 1, the no cases stays about the same – the disease is endemic.
We’re aiming for R0 less than 1 – the number of cases is shrinking over time.
For coronavirus, R0 was initially expected to currently be between 2 and 3. (https://academic.oup.com/jtm/article/27/2/taaa021/5735319)
Unfortunately, more recent data (May 2020) suggest that the R0 value for Covid-19 Coronarirus is probably closer to 5.7. Twice as infections as initially thought.
https://wwwnc.cdc.gov/eid/article/26/7/20-0282_article
Whats this got to do with “Flattening the Curve”
In simplest terms, the aim of social distancing policies is to reduce R0.
If we can get it below 1, the disease will theoretically just disappear over time! By reducing the number of people we’re all in contact with, and having strict guidance about isolation when you’re ill, it reduces the number of people that an infected person could or will infect.
In turn this reduces the number of cases at any given time. This produces an effect called ‘flattening the curve.’ That’s the exponential curve of cases over time.
Look at our simple exponential graph above, showing the number of cases over time. With R0>1, it’s not long before the infection numbers skyrocket and become catastrophic.
If this happens, then health services will be totally overwhelmed, and people will die because there are just no hospital beds available to provide medical care for them.
If we can flatten the curve, by reducing R0, you see that it takes longer for the number of cases to get to the same critical level where hospitals reach capacity.

credit: http://ctbergstrom.com/covid19.html
This is the basis idea behind flattening the curve.
We want to keep the number of contagious people at any one time below the maximum capacity for health services.
And we do this by reducing infection rates (R0) and ‘flattening the curve’.
To help understand, lets use the analogy of a bank loan, where we equate the total number of cases of coronavirus to the total amount you owe. Your debt will grow exponentially due to interest costs. Flattening the curve is equivalent to lowering the interest rates, and the result is less debt, that is fewer cases.
Consider alternatively this analogy: you are in a leaky boat which you are trying to keep afloat. The rising level of water in the boat is equivalent to the rising number of COVID-19 cases, and the boat sinking is equivalent to the health service being overwhelmed.
Now most people who contract the disease recover – this is you bailing water out of the boat. By flattening the curve, you are trying to plug the leak so that the water level rises slower or even stops.
To Sum Up Modelling an Epidemic
- Epidemiologists use mathematical models, like linear and exponential models, to predict how different real-world numbers vary relative to each other
- At the start of an epidemic, exponential growth is a good model
- Flattening the curve decreases the speed at which the number of cases rises in an epidemic
- It’ll get better – an exponential model isn’t applicable for ever!